 +
+ 
Needle Inspector — DevTools and MCP for three.js
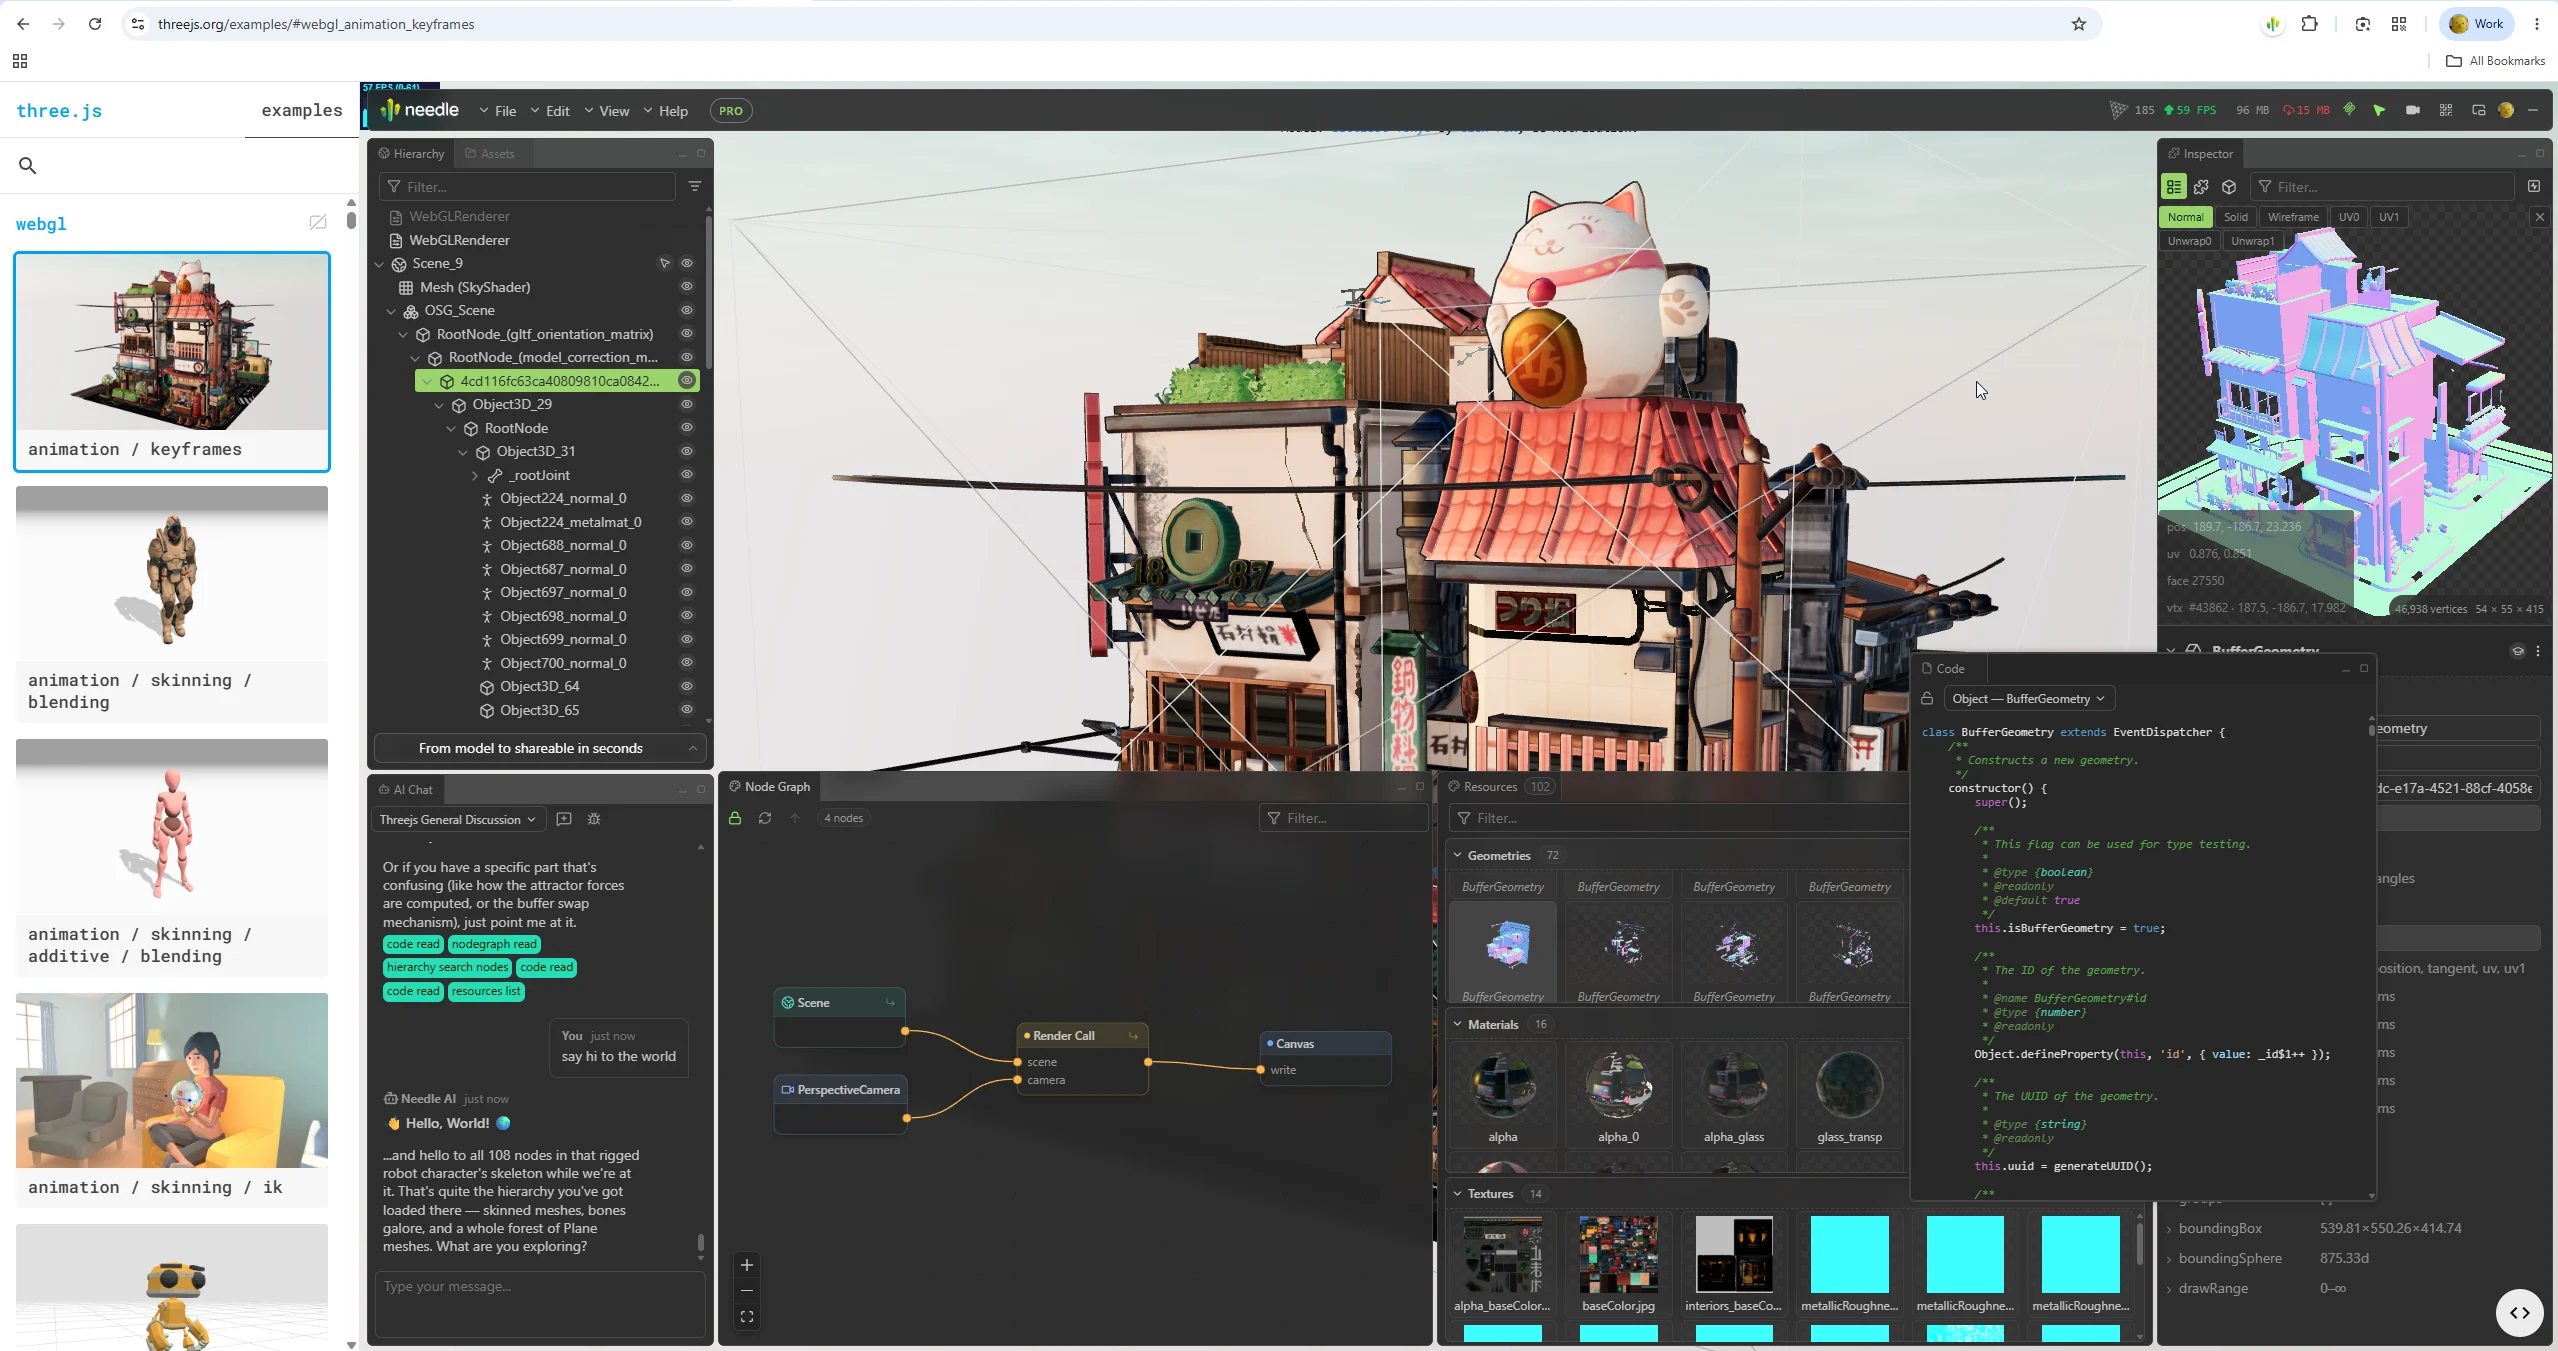
The Needle Inspector brings Chrome DevTools for three.js to your browser. Use this free Chrome extension to inspect and debug three.js, React Three Fiber (react-three-fiber), and Needle Engine scenes with WebGL and WebGPU renderers. Think of it as the browser's built-in inspector for 3D scenes: explore the scene hierarchy, inspect properties, and track performance. Needle Inspector Pro adds live property editing on development servers, memory and leak tools, AI editing via MCP, and export.

Quick Start
- Install the extension from the Chrome Web Store
- Open a webpage with a three.js scene.
- Click the Needle icon in the browser toolbar to enable the Inspector for that site. The page reloads.
- When the Inspector detects a scene, browse the hierarchy and select an object to inspect its properties.
Click the toolbar icon again to disable the Inspector for that site. This also reloads the page.
Inspect three.js websites
You can inspect three.js, React Three Fiber, and Needle Engine scenes on public websites as well as your own projects. Use it to understand how a scene is built or investigate a production issue.

Features
Real-time Scene Inspection
Browse your 3D scene hierarchy, similar to how the browser's Elements panel shows your HTML structure. Scene hierarchy inspection is free.
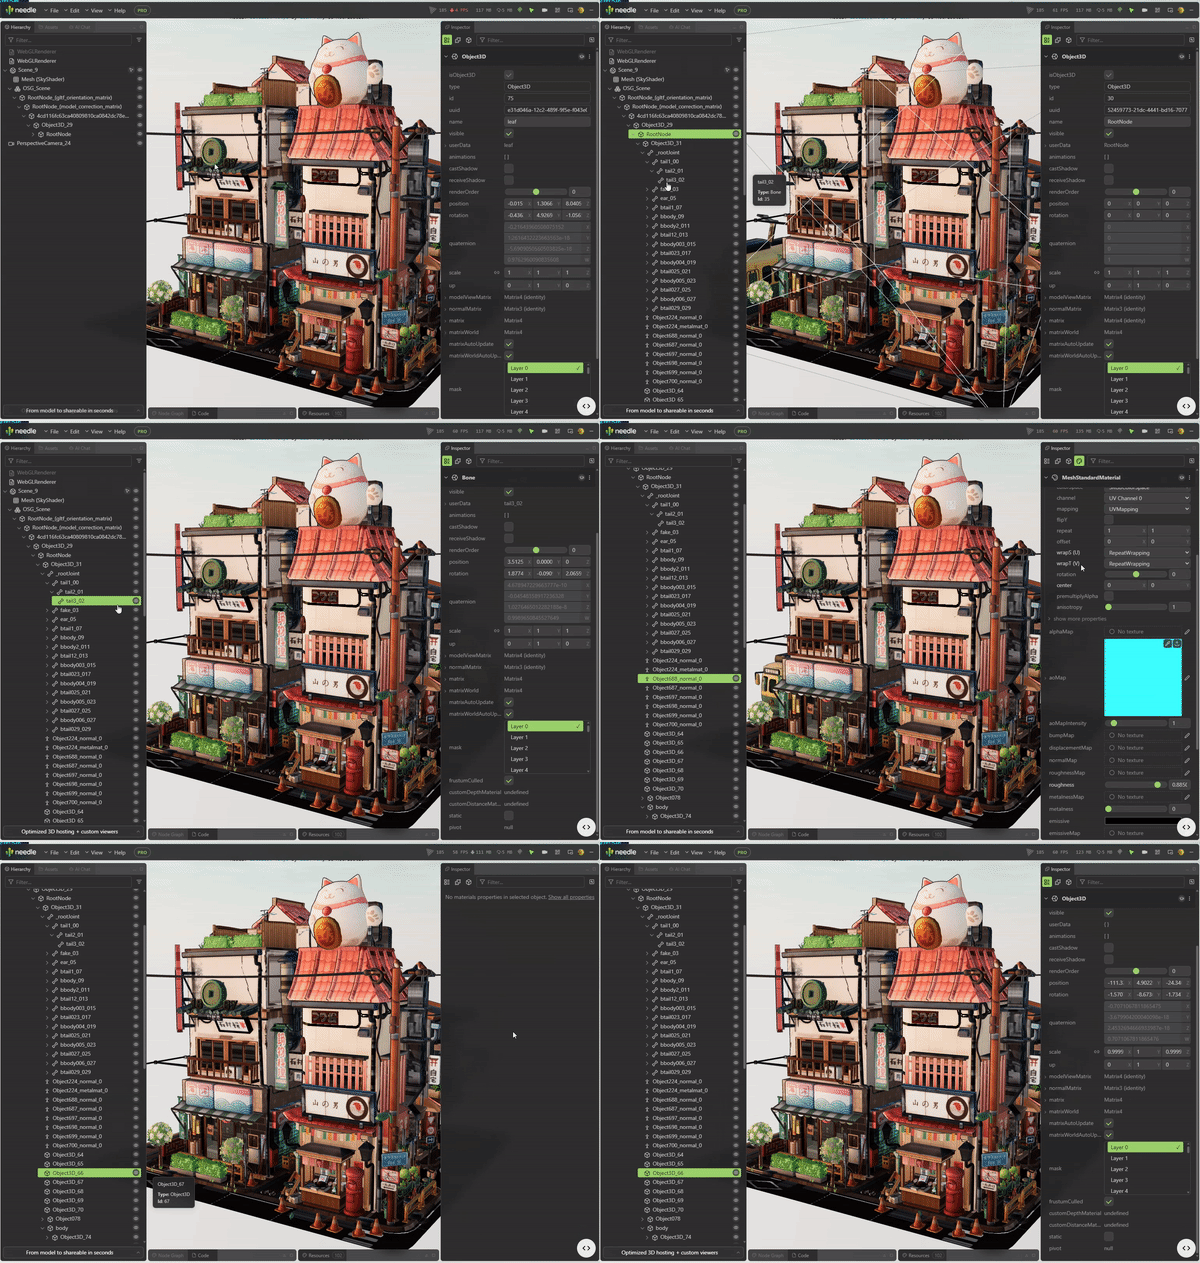
- Scene Hierarchy: Browse all objects, meshes, lights and cameras in an expandable tree view
- Search & Filter: Quickly find objects by name or type
- Live Updates: The tree follows your scene in real time as objects spawn, move and unload
- Isolated Inspect View: Right-click any object to view it alone in a dedicated 3D view
Live Property Editing
Tweak transforms, materials, lights and textures on the running scene and watch it react — every change goes through a real command system, so Ctrl+Z / Cmd+Z undo works like in a desktop editor.
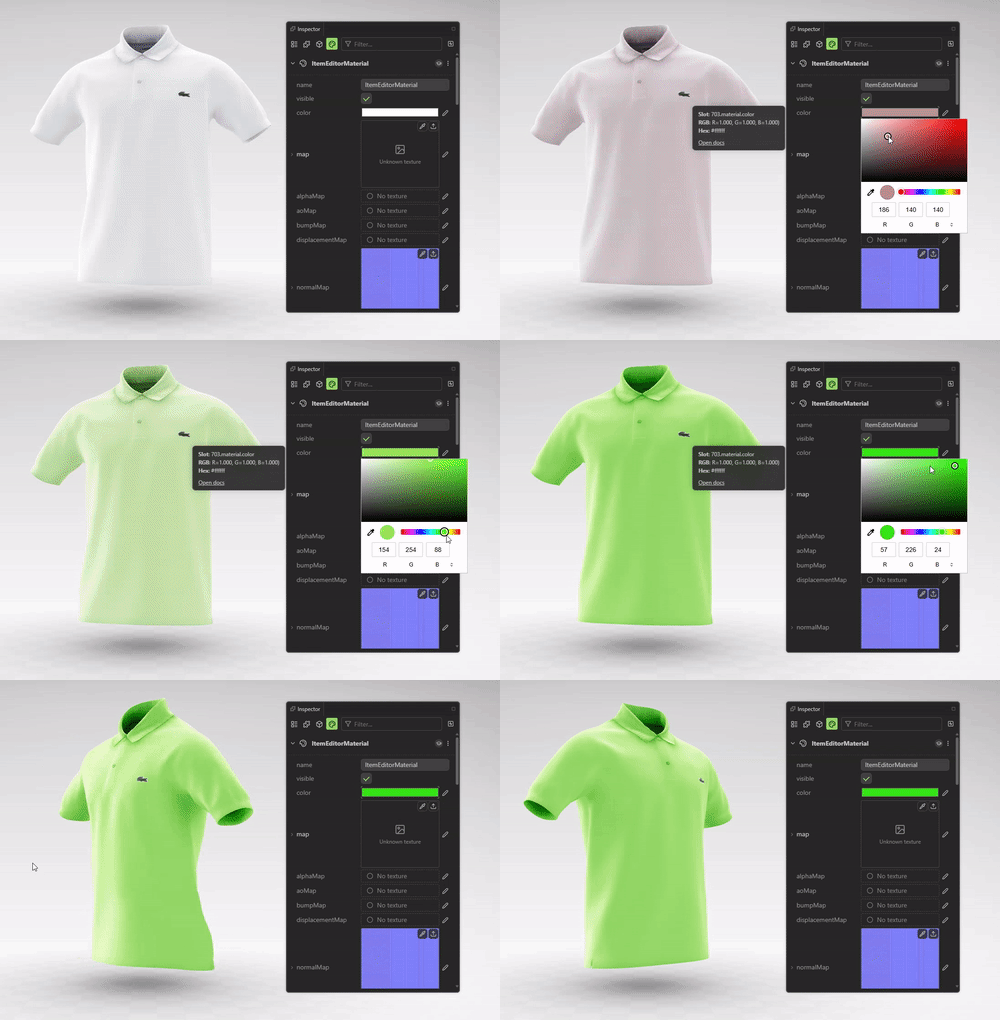
- Transforms: Position, rotation and scale with draggable number inputs
- Materials: Colors, maps, opacity, emission, roughness/metalness and rendering flags — including values baked into your GLBs that no code sets
- Textures: Preview, inspect and swap texture slots
- Visibility & Flags: Show/hide objects, toggle features live
Property editing is free on ordinary public websites. Editing on localhost, LAN development servers, and supported development, preview, and staging hosts requires Pro.
Free-Fly Camera
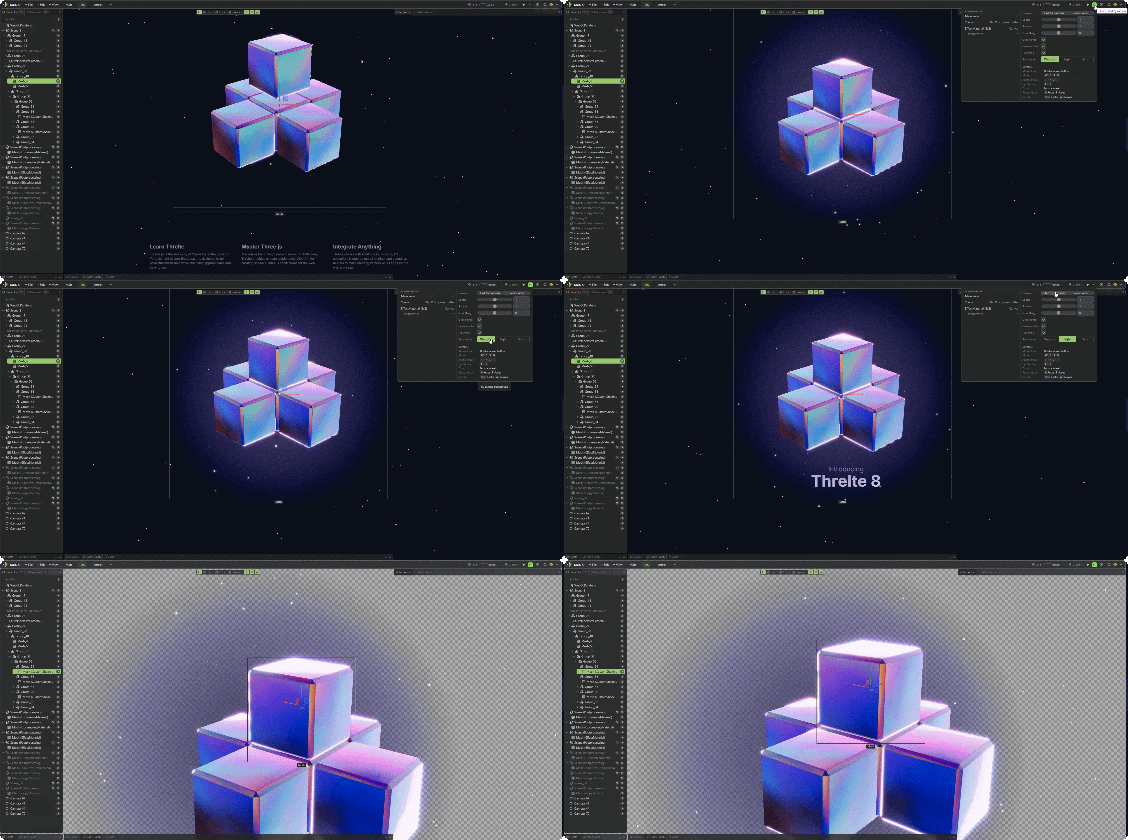
Explore the scene from another angle. Click the camera icon in the top right to enable the fly camera, then use WASD to move through the scene. The camera remembers its last position and restores it when you return.
Inspect Above HTML and Change the Background
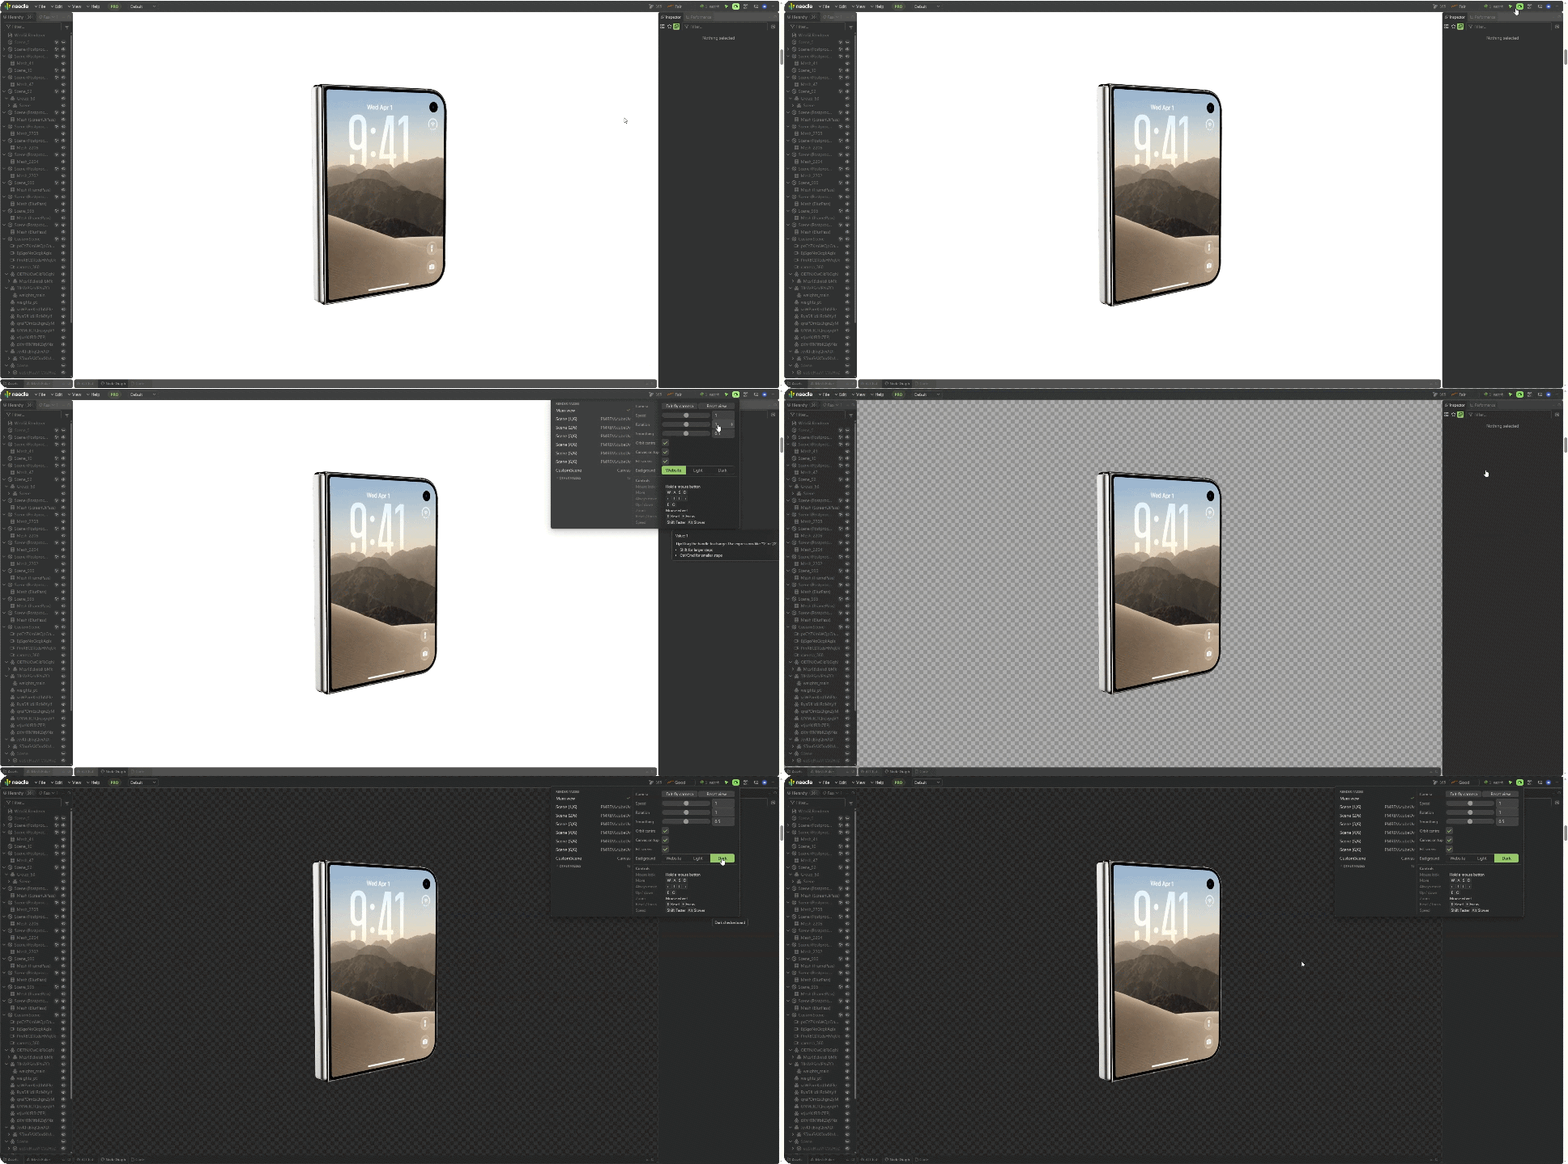
The fly camera can display the scene above the website's HTML, so page content no longer blocks your view. You can also temporarily expand the canvas to fill the browser viewport during inspection. Keep the website background or switch to a neutral light or dark checkerboard to inspect transparency, edges, and post-processing effects more clearly.
Camera Animation Timeline
Open the Animation workspace to build a camera move while viewing the live scene. Use the free-fly camera to frame a view, add a camera clip, then capture more views as keyframes. Drag keys to change their timing, scrub or play the timeline to preview the move, and move or trim clips to arrange shots with hard cuts. Select a clip or keyframe to edit it in the Inspector.
Camera animations are saved locally for the inspected page. Camera animation is limited in the free version. Pro supports longer sequences and lets you import or export the camera animation as JSON from the camera track menu. This JSON file is separate from the scene GLB export. The timeline currently animates the Inspector camera, not arbitrary scene objects.
AI-Powered Assistance 



Let your AI assistant inspect and edit the running three.js scene. Use the built-in AI chat or connect an MCP client such as Claude Code, Cursor, VS Code, or Antigravity.
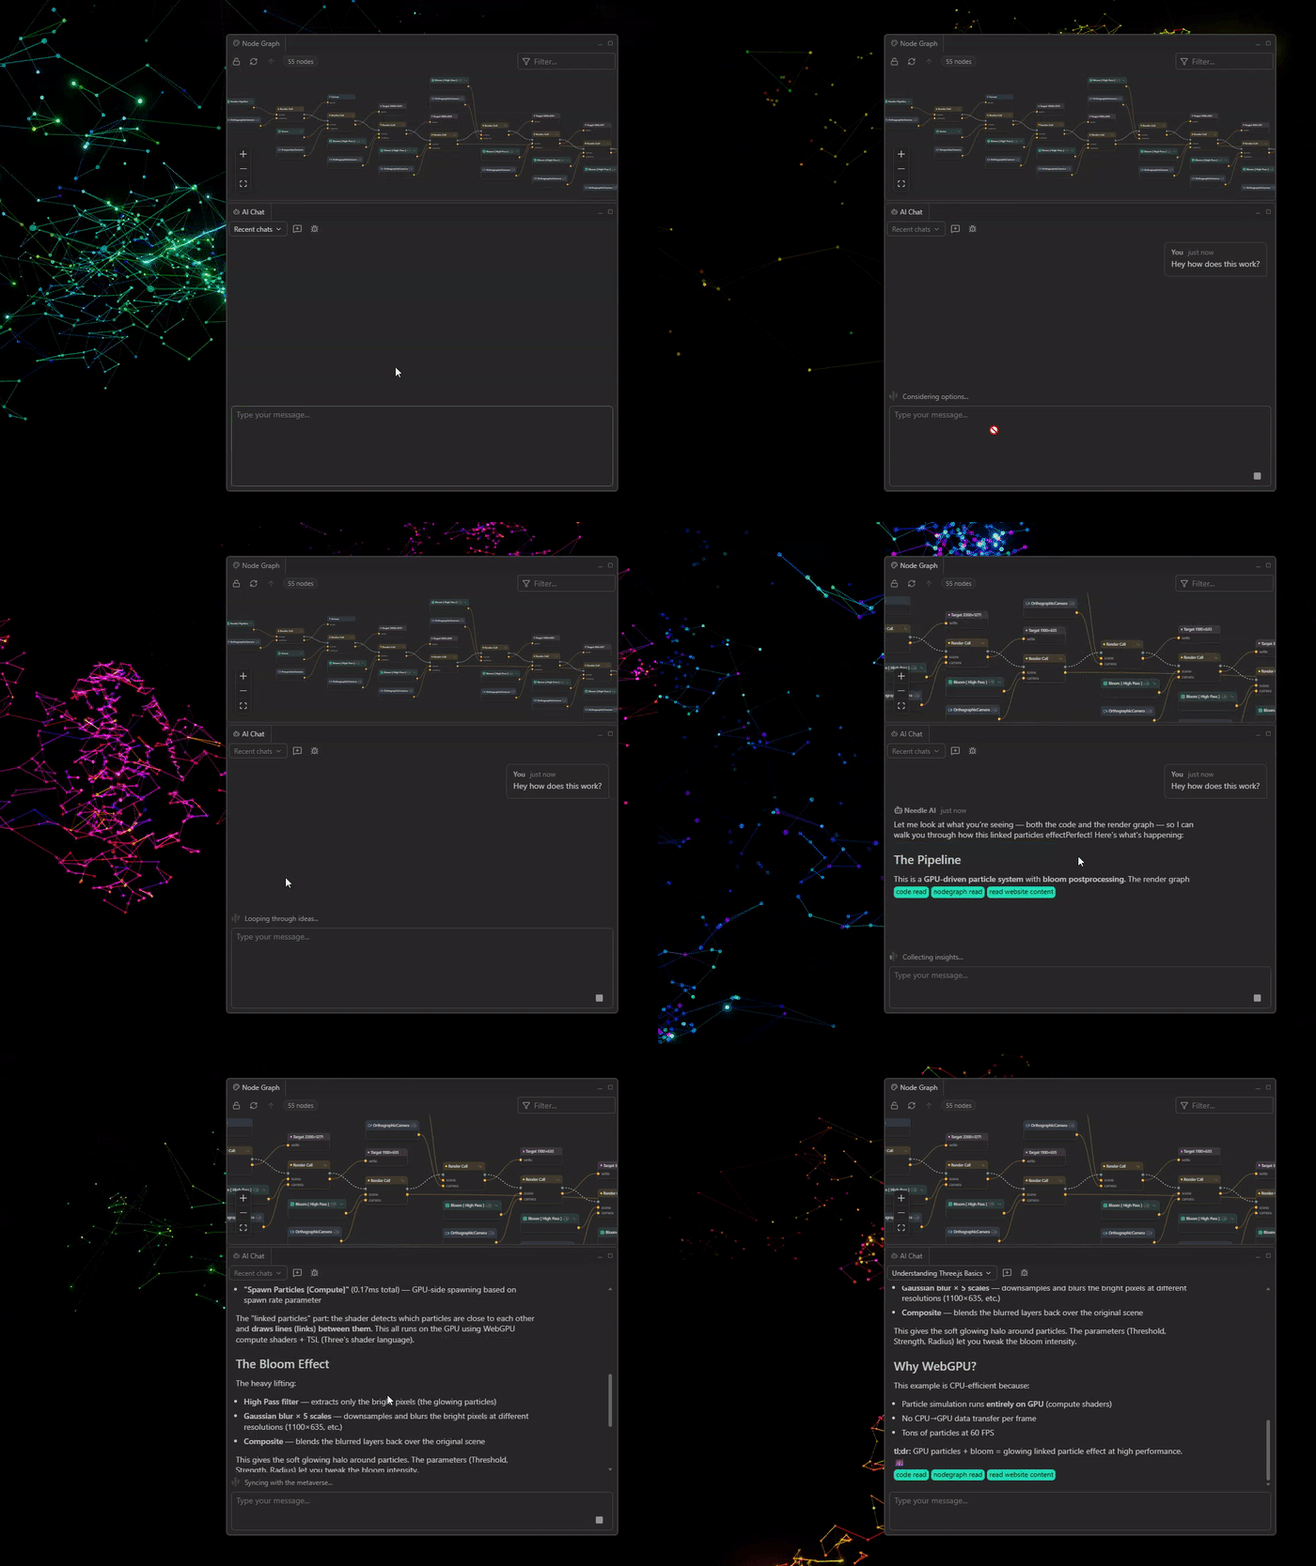
- MCP Integration: Your agent reads the hierarchy, inspects objects, changes properties, and pulls your pending edits (
get_edits) to apply them to your source code - Built-in AI Chat: Ask questions about the open scene without leaving the browser
- Available tools: View the MCP tool list in the Inspector settings. Some tools are specific to the built-in chat or available only in certain contexts.
Ask AI about anything
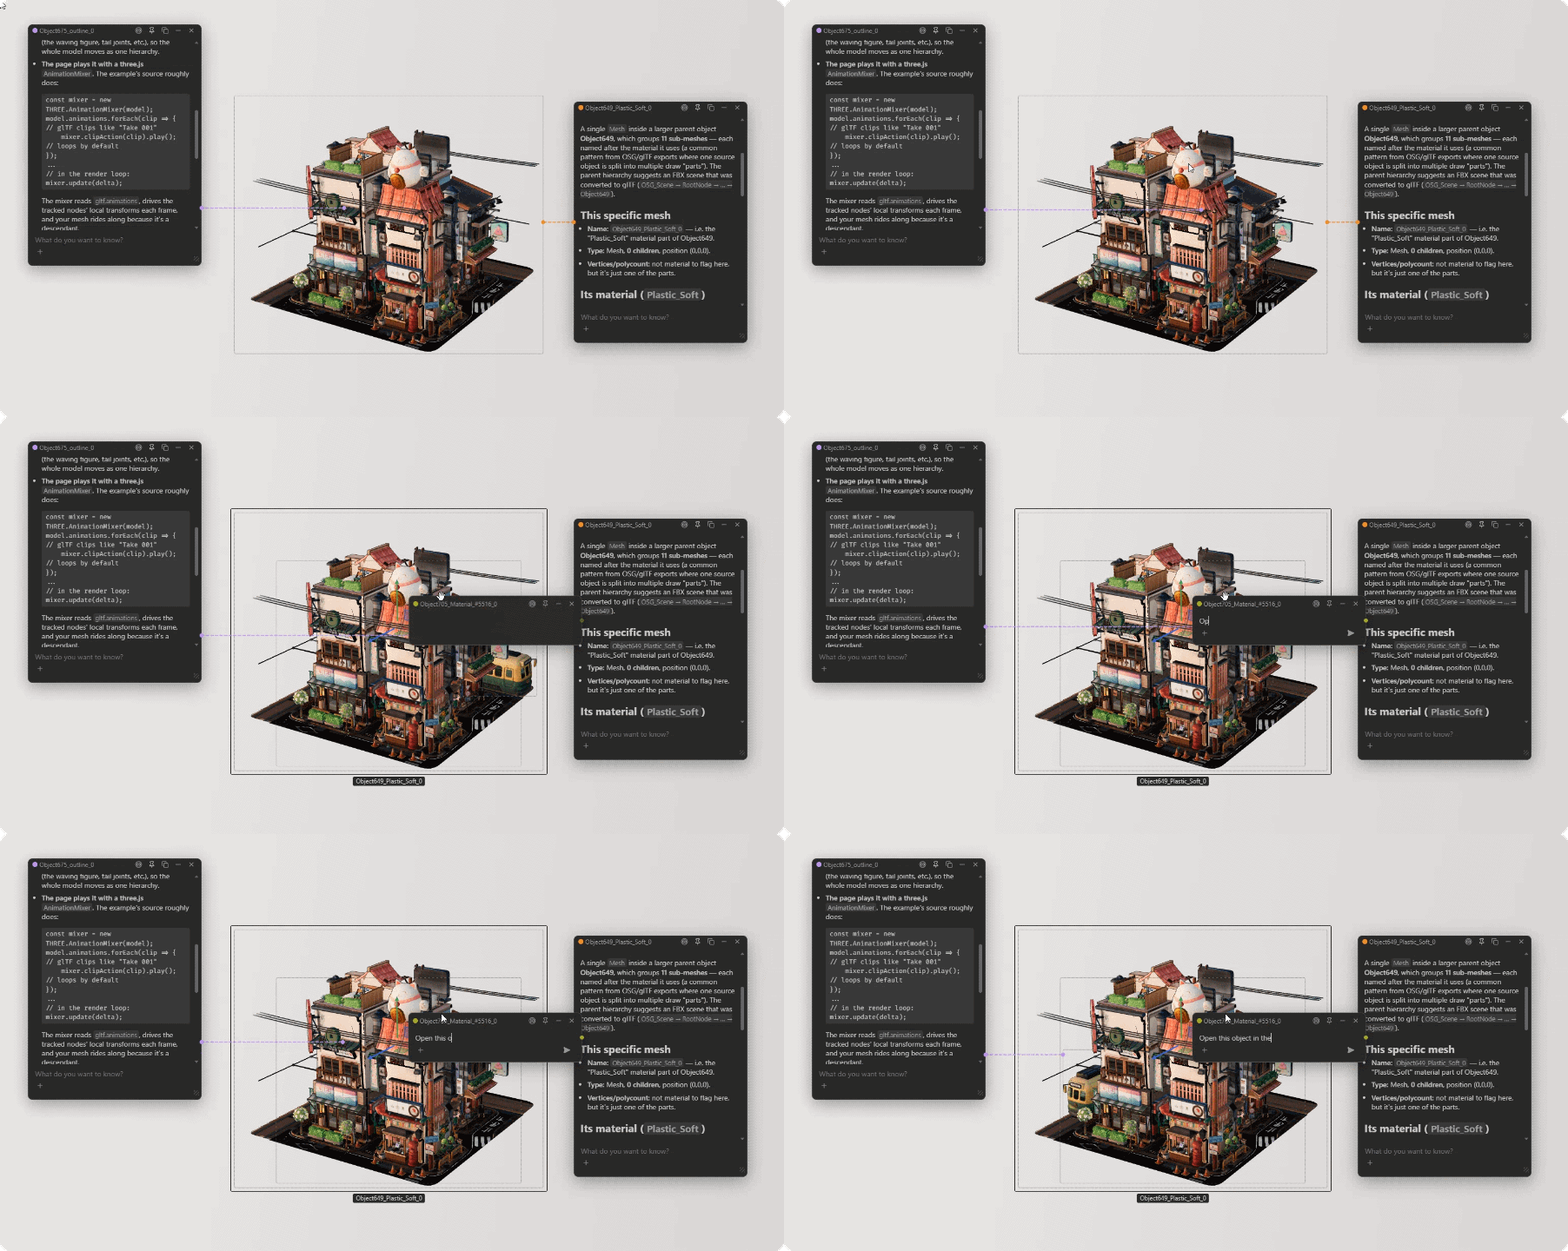
Right-click any object in the hierarchy or the 3D scene — or any property in the inspector — and Ask AI about this. The chat opens as a small bubble pinned to the thing you asked about, so the AI already has the context, and you can keep several conversations going at once while you work.
Setup is simple:
npx needle-cloud startKeep the terminal open, then connect your AI client to http://localhost:8424/mcp. Learn how to connect your local AI tools: Needle MCP documentation.
MCP & AI editing is part of Pro.
Save and Export Changes
Use these tools to save changes made to the running scene:
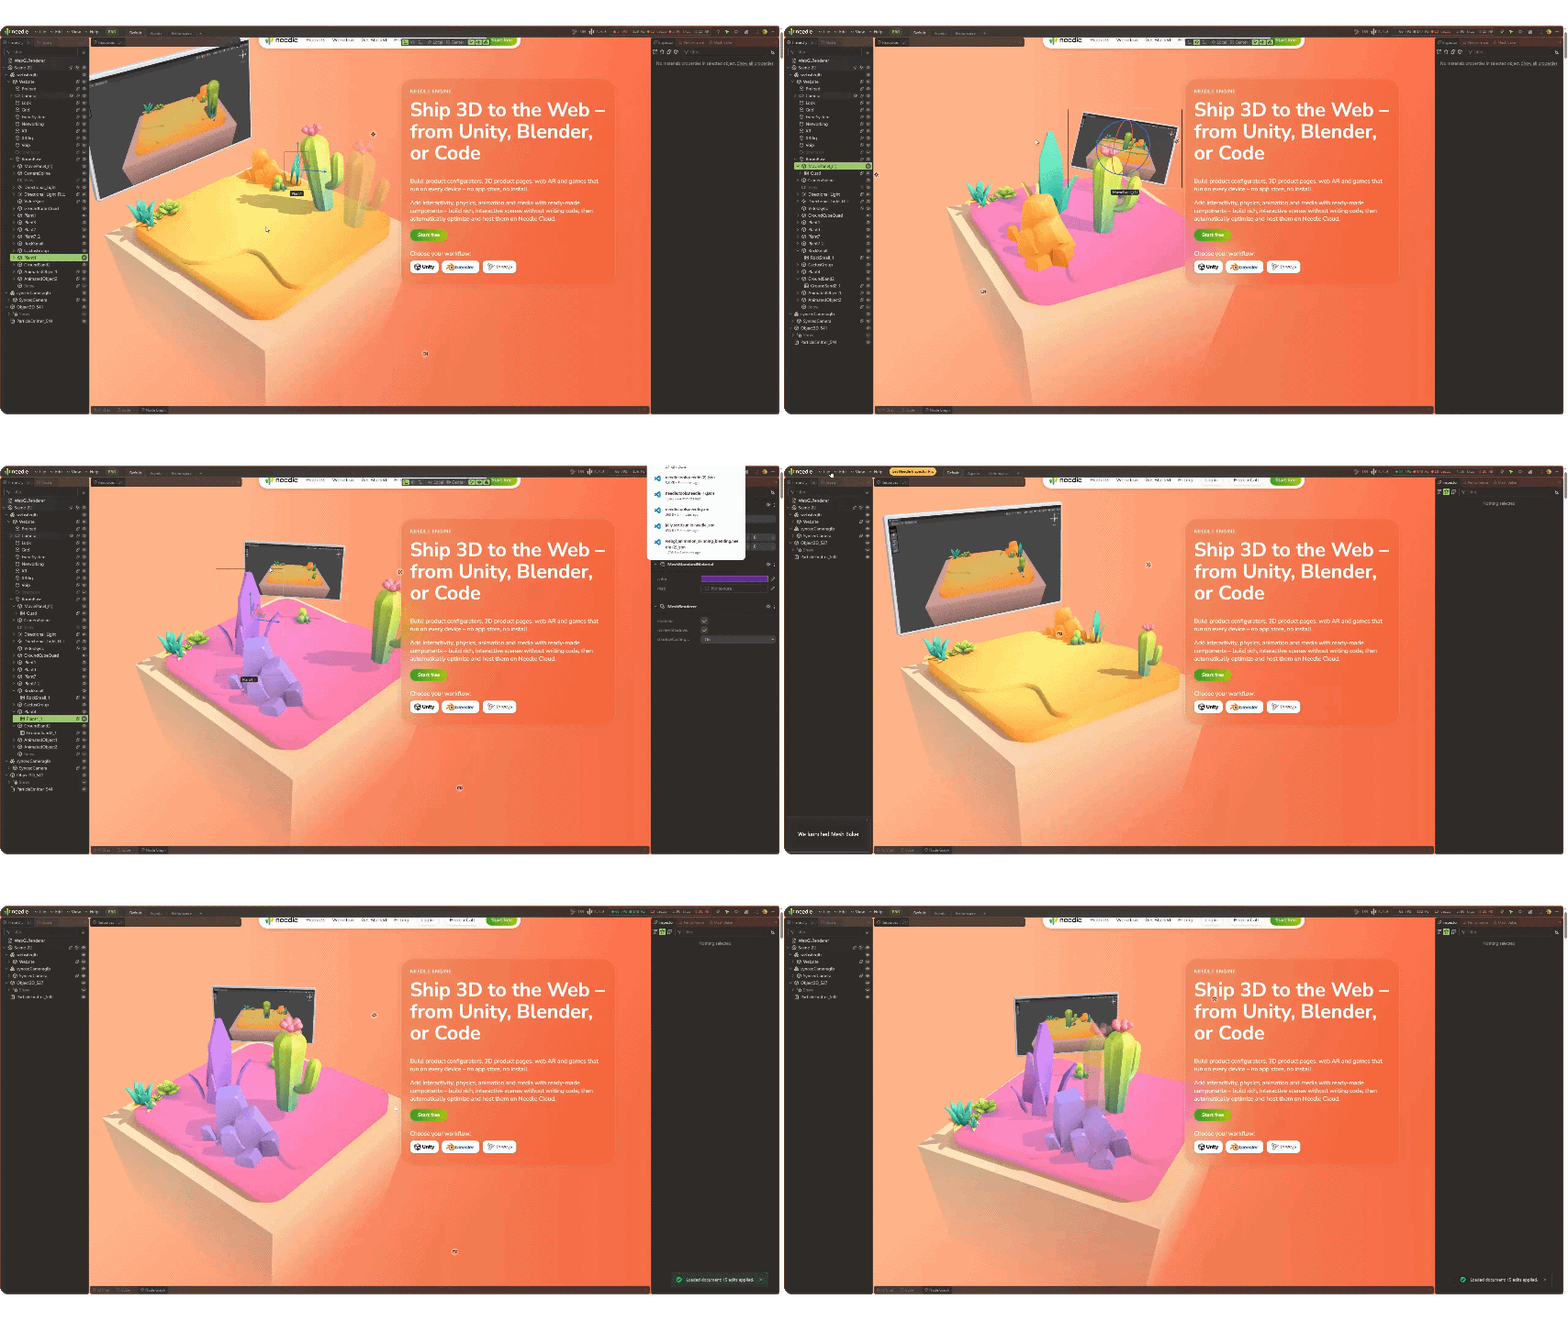
- Save and Load Edits: Use File → Save Edits to export your edits as JSON, and File → Load Edits to load them back into the Inspector. Hand the JSON to an AI agent to apply the changes to your local project's source code, or share it with a team member. You can also save a readable text version.
- Edits via MCP: A connected AI agent can read your edits directly with
get_editsand apply them to your project's source code. - GLB Export: Export objects or whole scenes as glTF/GLB — textures and animations included
- Texture Export: Right-click any texture slot to download that texture as a PNG
- Undo History: Undo and redo edits made through the Inspector command system
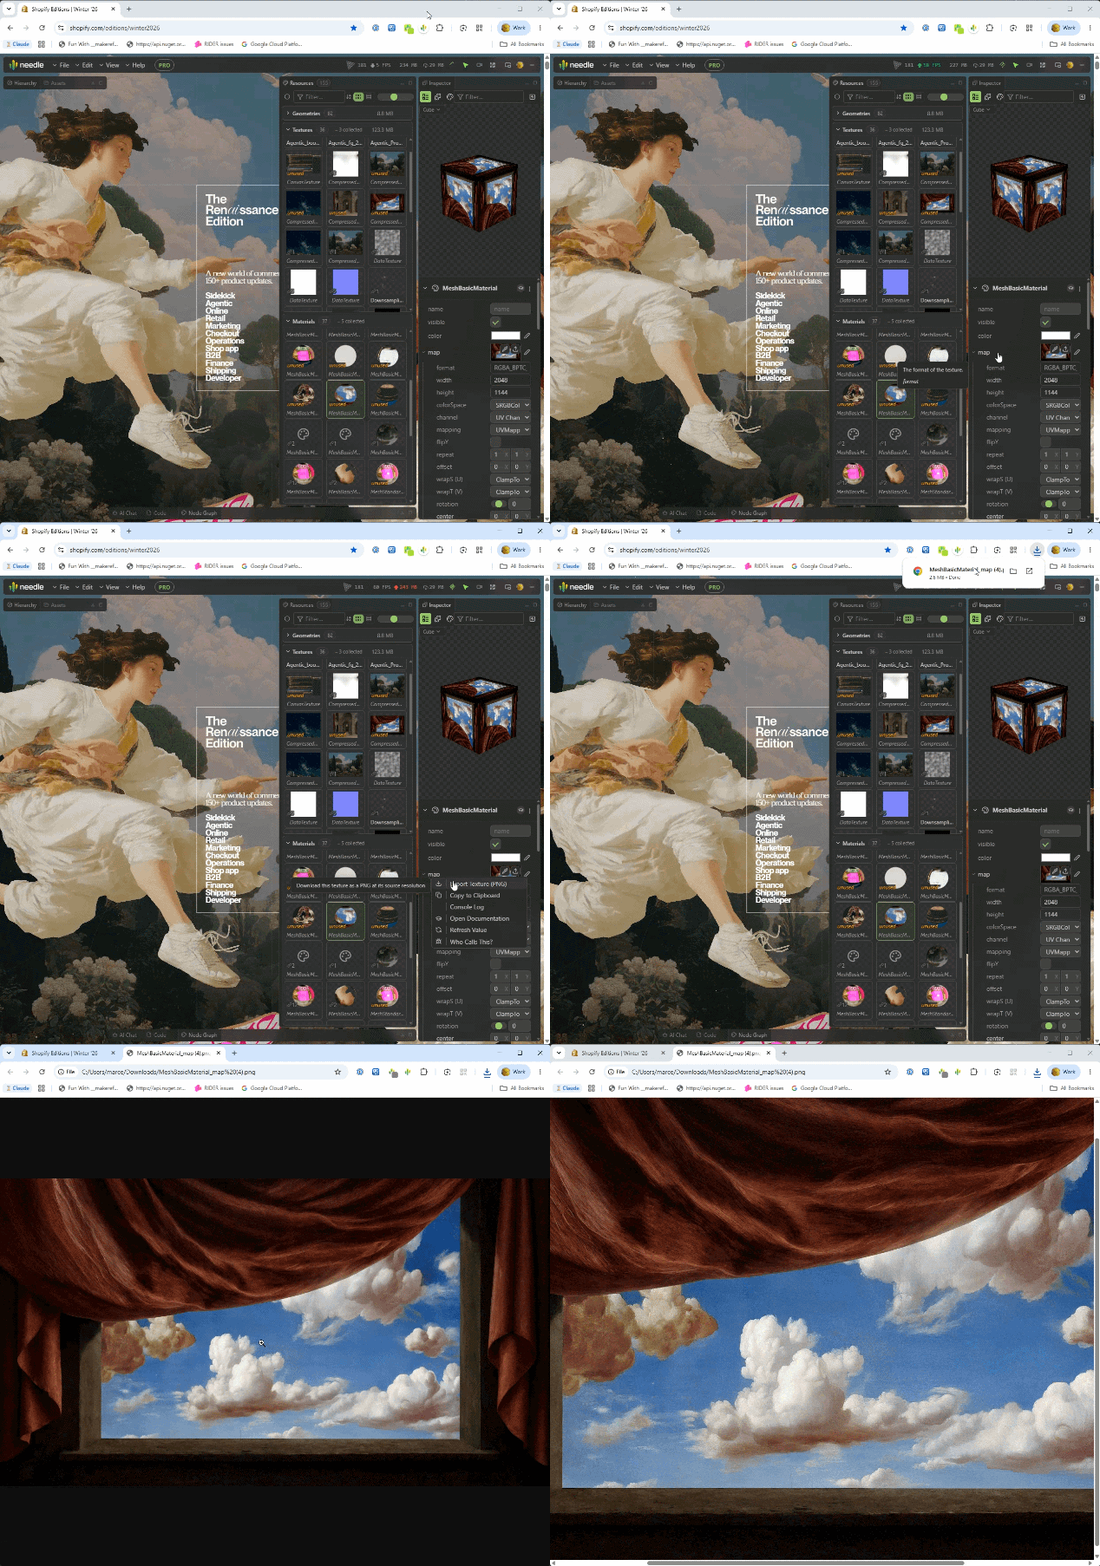
Saving edits, GLB export, and texture export require Pro.
Performance Panel
Track frame rate, memory use, and rendering work over time. Pause the graphs to investigate a spike.
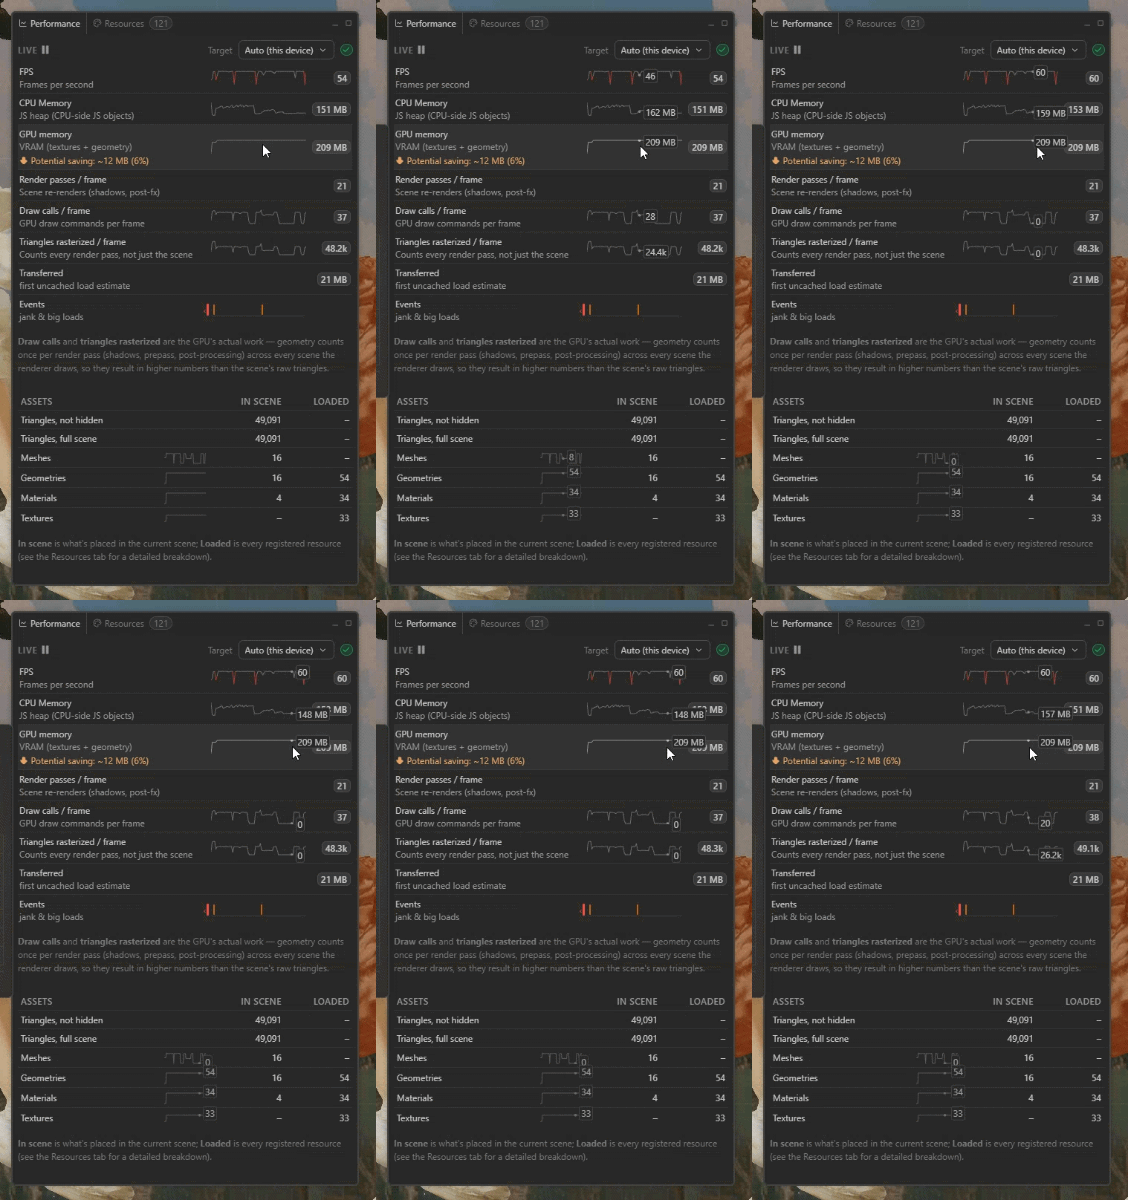
- FPS, CPU memory and GPU memory (VRAM) as running graphs, with the current value next to each
- Render passes, draw calls and triangles per frame — the GPU's real work, counted across every pass (shadows, prepass, post-processing), not just the scene's raw triangle count
- Potential VRAM saving: how much texture memory compression would reclaim
- In scene vs. loaded: meshes, geometries, materials and textures that are actually in the current scene, next to everything the page has loaded
- Events: jank and big loads marked on the timeline — a long frame names the function and file behind it, and in local development you can jump straight to the line of code that caused the stall
- Pause at any moment to read the numbers behind a spike
Resources & Memory
Inspect loaded textures, geometries, and materials with estimated memory use. Track what loads and unloads to investigate memory growth and potential memory leaks in your three.js scene.
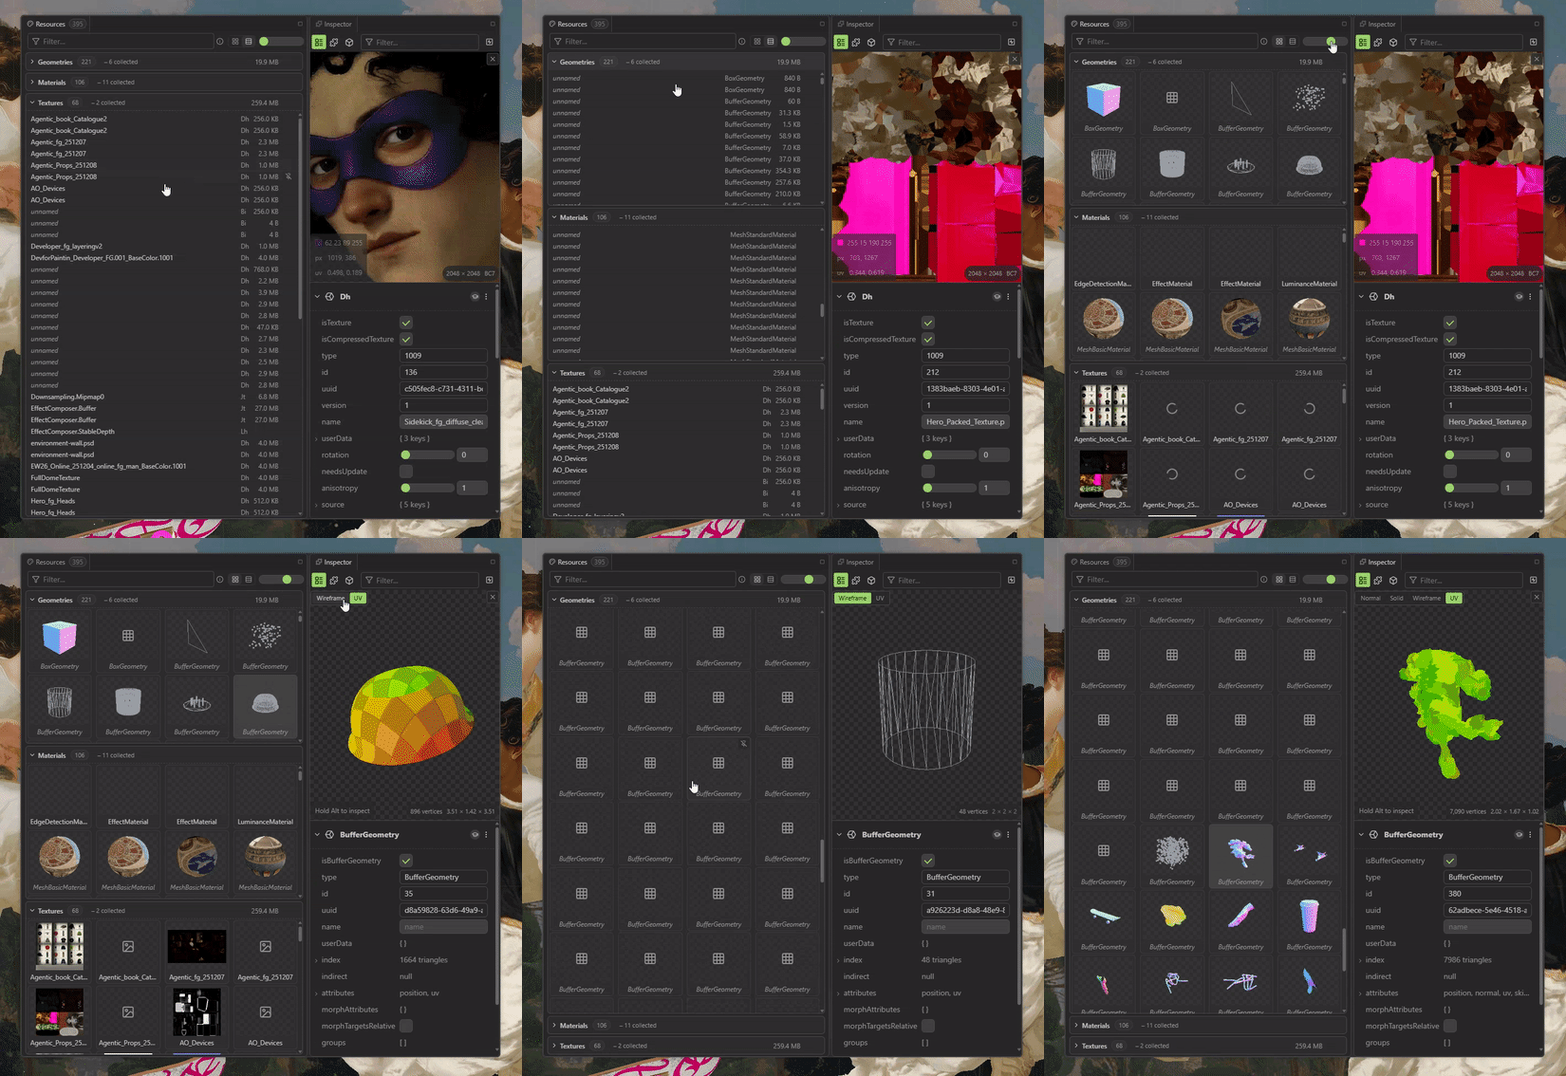
- Every texture, geometry and material with memory estimates
- Load/unload tracking: Spot resources that never get freed — memory leaks show up as rows that never disappear
- Draw calls, triangles, FPS and download size at a glance
The free tier shows a preview of each group; the full resource list is part of Pro.
Node Graphs & Rendering Insight
See how your frame and shaders are actually built:
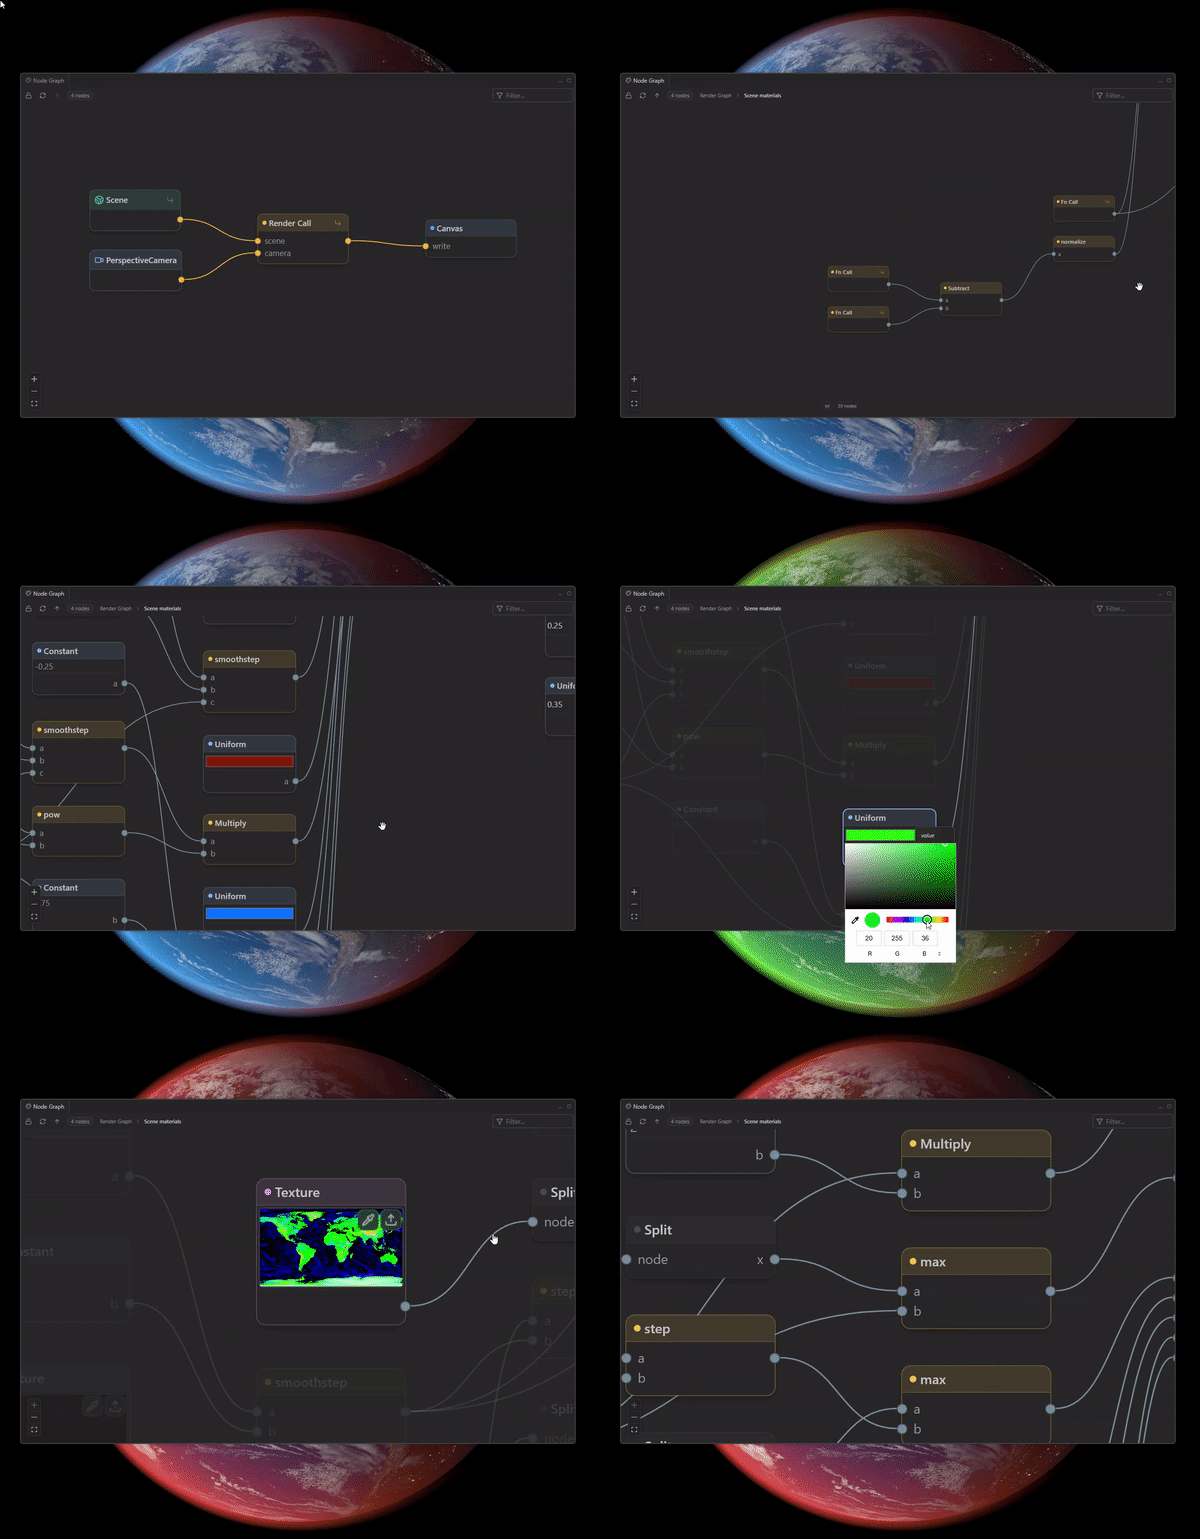
- Material Node Graphs: Explore materials as node graphs (including three.js TSL / node materials)
- Render Graph: Capture a frame and see every render call, pass, target and their dependencies
Viewing the full graph is free — stepping into subgraphs and functions and re-capturing frames is part of Pro.
Code View — Shaders & Source
The code behind any selection, one click away:
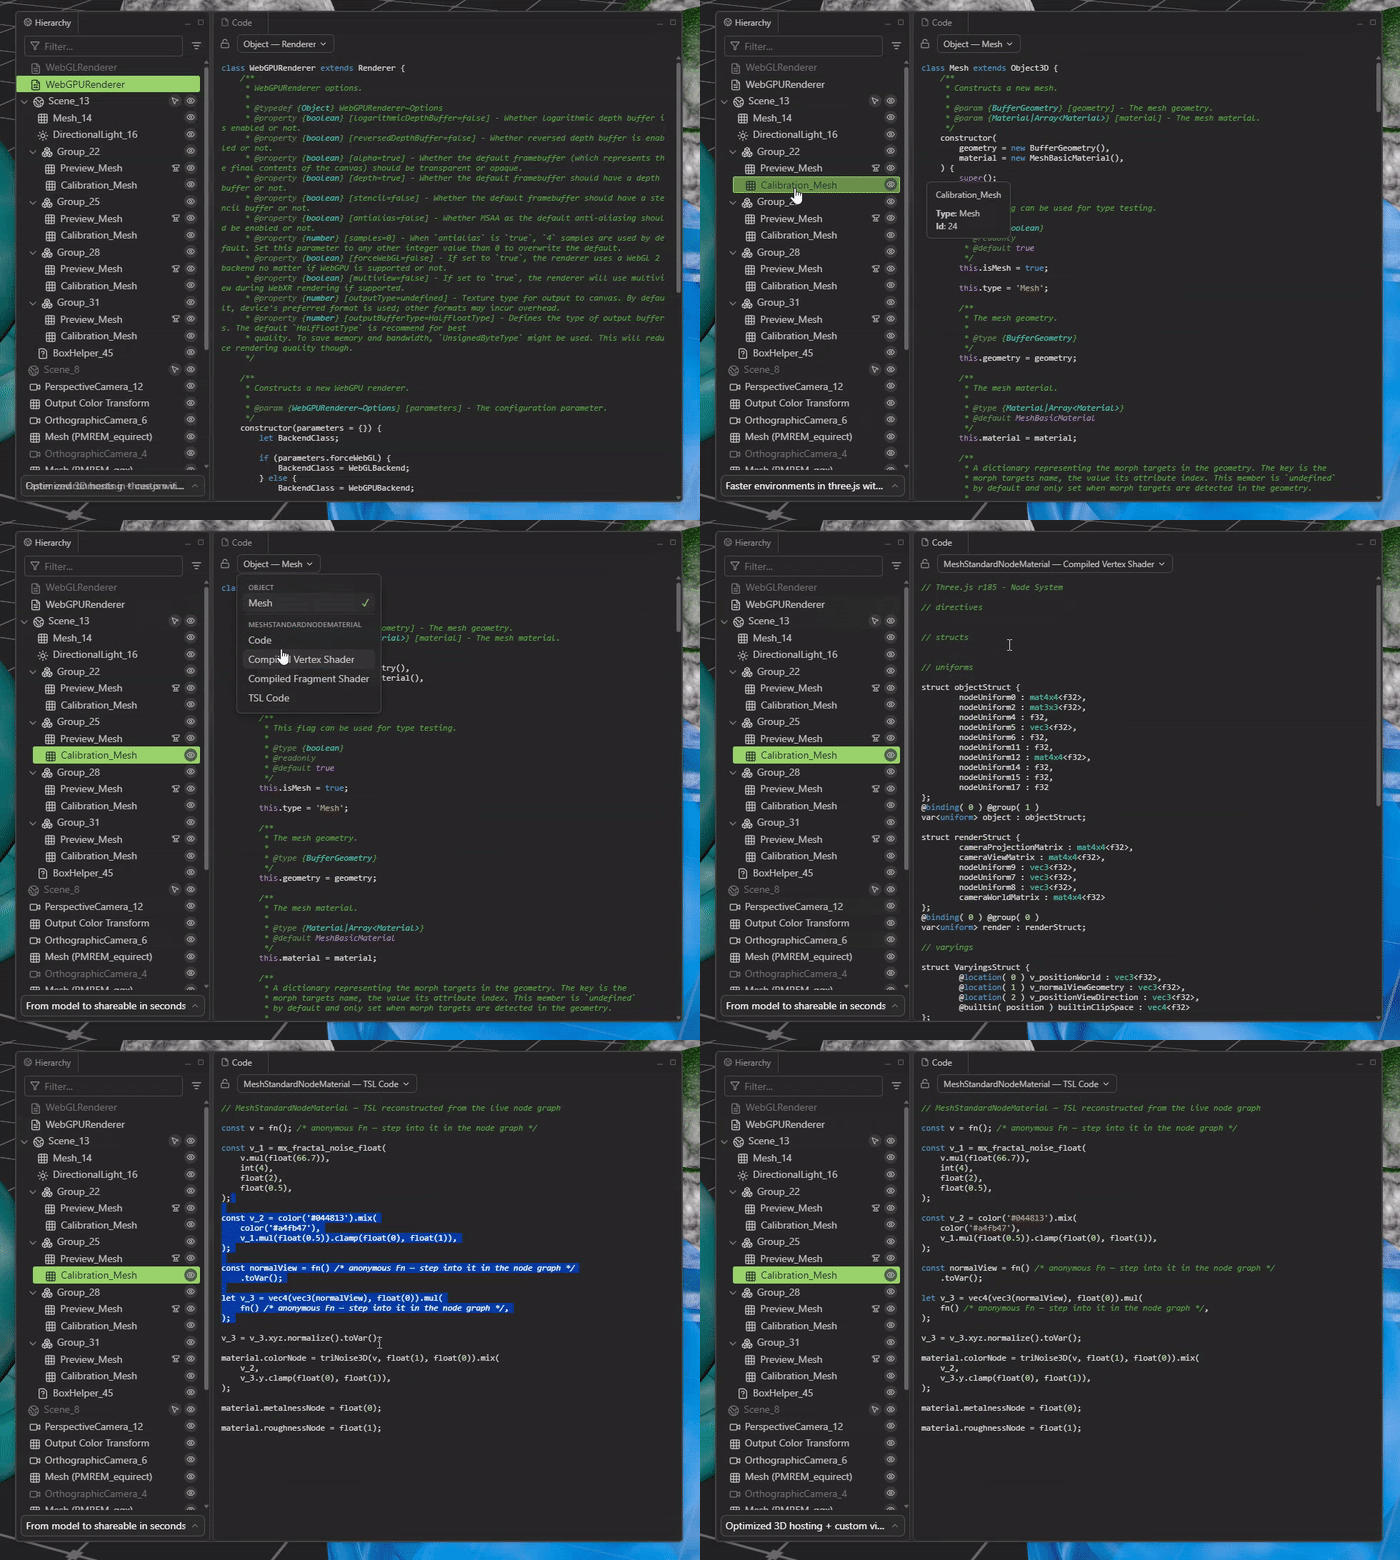
- TSL, compiled shaders & three.js source: Switch between the TSL code, the compiled vertex/fragment shaders and the three.js source of the selected material or object
- Follows your selection: Lock the view to pin a source while you keep browsing — and copy out whatever you need
Your own three.js/object source and authored shaders are free. The inspector-generated sources — compiled shaders and reconstructed TSL — show a trimmed preview on the free tier; the full output is part of Pro.
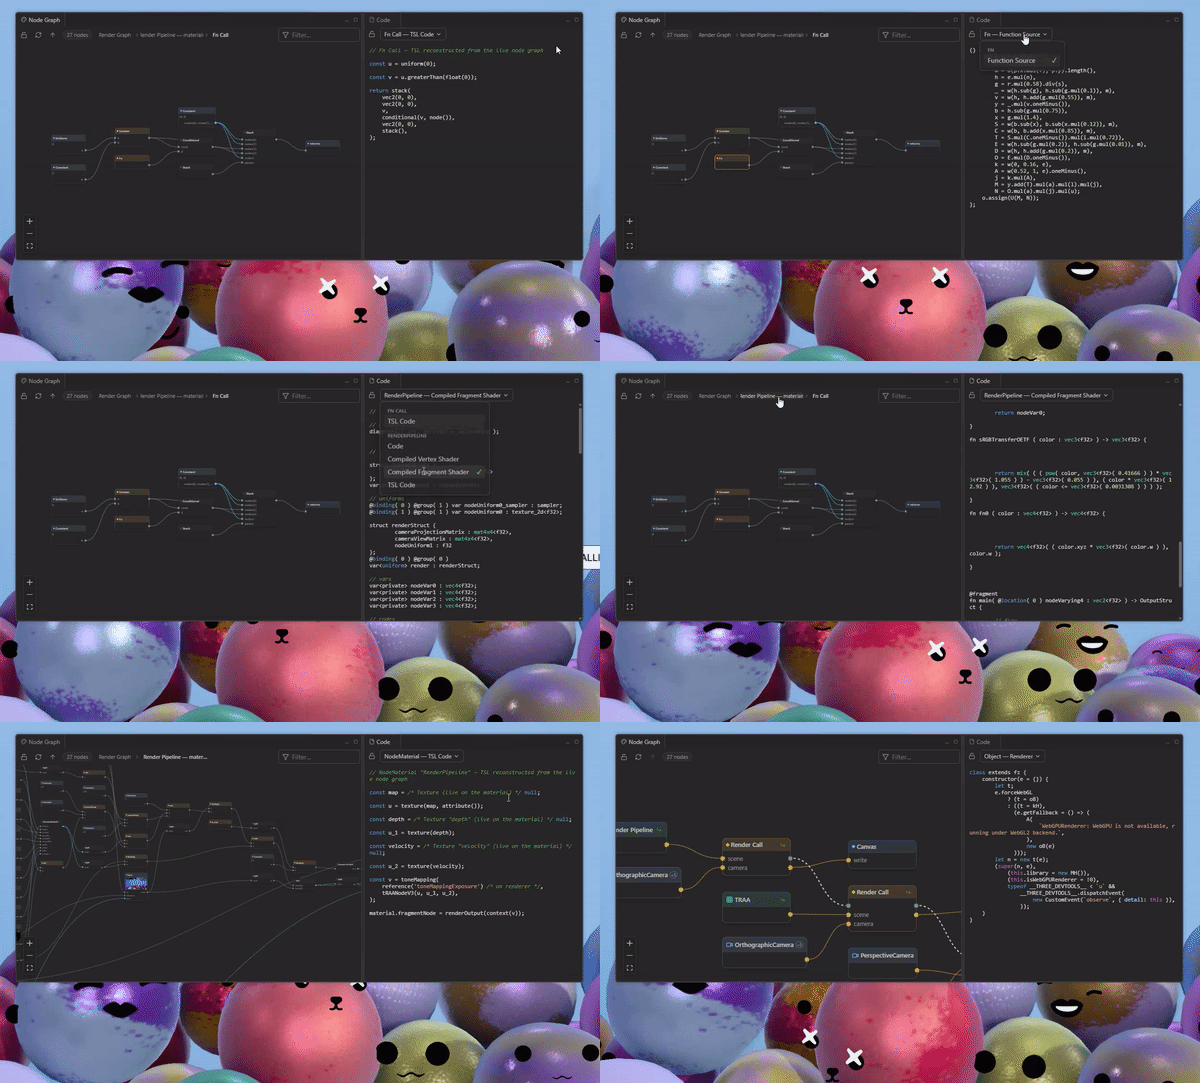
Works side by side with the node graph — the source for exactly what you're looking at
Built-in Assets Browser
Drop new content straight into a running scene — no downloads, no code changes:
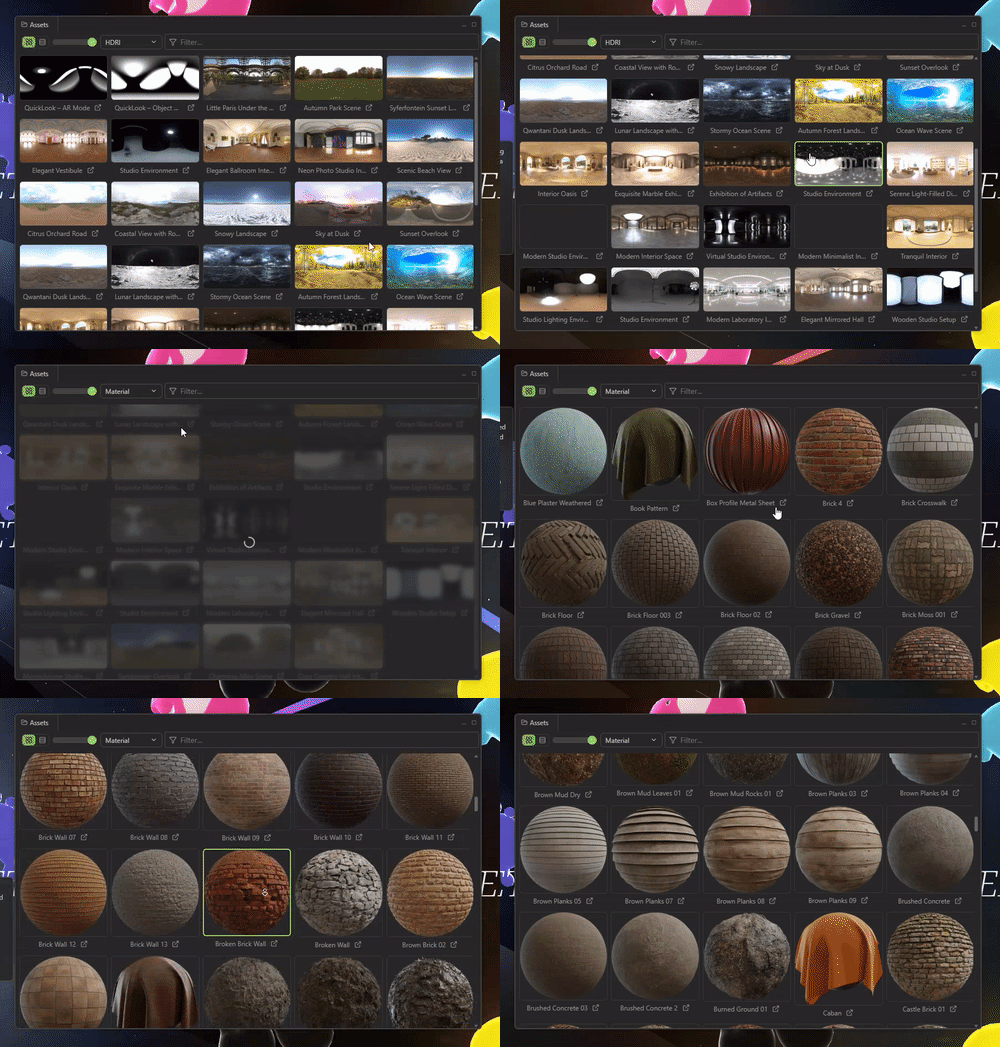
- HDRIs & Materials: Browse a curated asset library with instant previews
- Drag & Drop: Pull a material onto any mesh in the scene
- One-click Lighting: Set an HDRI as the scene environment and background instantly
Browsing the library is free; applying assets is part of Pro.
Pop-Out Window
Move the Inspector into a separate window to give your scene more space. Arrange the window beside your browser or on another monitor while you inspect the running scene. The pop-out window remembers its position and restores it when you reopen it.
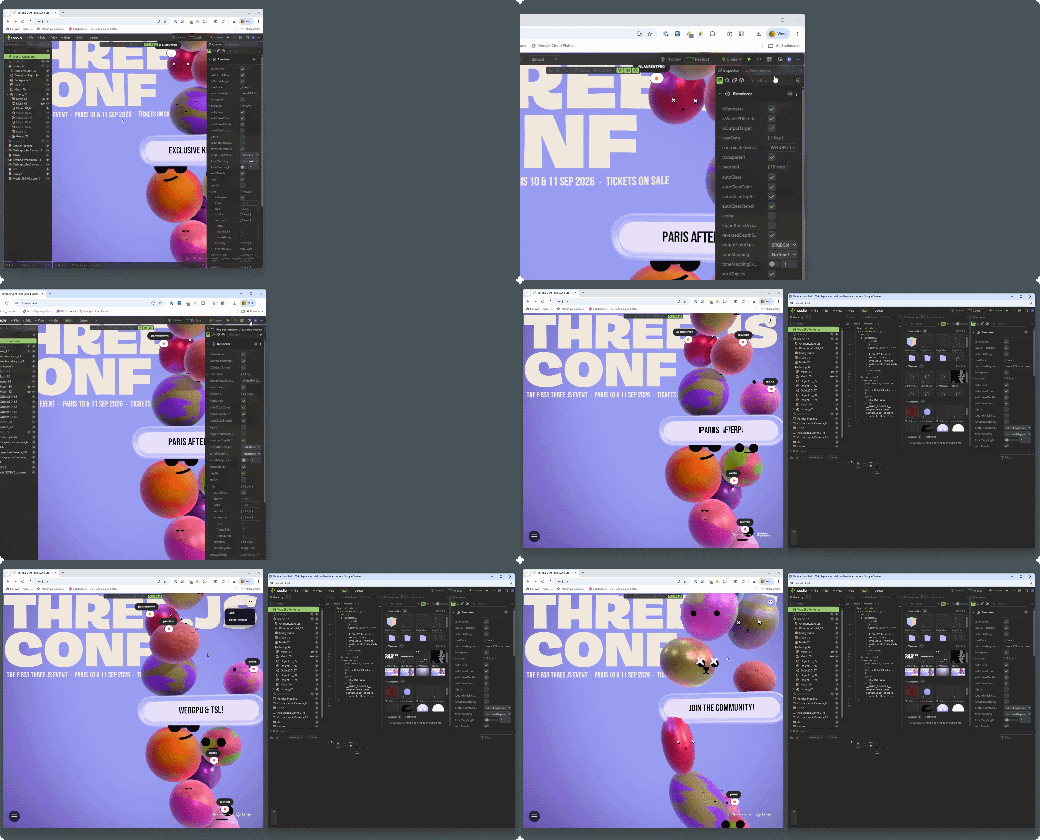
Optimize a Mesh Without Leaving the Scene
New in 2.5: send meshes straight to the Needle Mesh Baker without leaving the scene.
Drag objects from the hierarchy into a group — as many as you like — and bake each group on its own. A group comes back as one mesh, with transparent surfaces kept apart from opaque ones because they cannot share a material. A scene built from many small parts loses most of its draw calls along with its triangles.
The baked result lands in the running scene, and a toggle switches between the original and the baked version so you can compare the two in place. Adjust the triangle budget and bake again until it holds up.
Baking runs in your browser, and the mesh is not uploaded. Keeping a baked result needs the Mesh Baker; sending meshes over and looking at what comes back does not.
Free vs Pro
The free version includes scene inspection, performance stats, and property editing on ordinary public websites. Pro adds editing on development servers, full resource lists and generated shader code, node-graph drill-down, AI tools, and export.
| Free | Pro | |
|---|---|---|
| Scene hierarchy, search, live inspection |  on supported sites on supported sites | |
| Property viewing, node graphs, render graph, code view | on supported sites | |
| Node-graph drill-down (subgraphs & functions), frame re-capture |  | |
| TSL & compiled shader code | trimmed preview | full source |
| Performance stats | | |
| Live property editing | on public sites | including development servers |
| Camera animation timeline | limited keyframes | longer sequences, JSON import/export |
| Assets browser | browse & preview | apply |
| Resources & memory list | preview | full list |
| Inspector MCP tools & AI editing | | |
| Save Edits (JSON/text) | | |
| GLB export | | |
Needle Inspector Pro is a one-time purchase — no subscription, yours forever. It's also included with every Needle Engine Pro license, so if your team already uses Needle Engine Pro, just sign in.
To buy: open the inspector on any page and click Get Pro in the toolbar — the current price (and any running launch discount) is shown right there.
Supported Platforms
- Modern three.js versions — WebGL and WebGPU renderers, including TSL / node materials
- Needle Engine
- React Three Fiber
- Angular Three (Angular)
- A-Frame (via three.js)
- Threlte
- TresJS
- Any three.js-based framework
Needle Inspector vs. PlayCanvas and Spline
Choosing a browser-based 3D tool depends on where you want to build and edit your scene.
Needle Inspector works directly with a running three.js scene, including React Three Fiber and Needle Engine projects. Open your localhost project or a public website, inspect the scene, and edit transforms, materials, and lights in place. Use File → Save Edits to share changes as JSON and File → Load Edits to apply saved edits to the running scene. A connected AI agent can also read edits through MCP and apply them to your local project's source code. Live editing on development servers, saving edits, and Inspector MCP tools require Needle Inspector Pro.
PlayCanvas Editor provides a browser-based development environment for building applications with the PlayCanvas Engine. Choose it when you want to author scenes and develop a PlayCanvas application in a visual editor.
Spline provides a collaborative design environment for creating interactive 3D experiences. It supports code exports, including three.js and React Three Fiber, and its desktop app includes an MCP server for connecting AI clients.
If you already have a three.js project, Needle Inspector lets you inspect and make visual edits while keeping your existing framework, build tools, and source files. Save edits for a teammate or ask your AI agent to apply them to the project, then continue developing in your usual editor.
MCP also gives your AI agent access to the code it has running on localhost. It can inspect the resulting scene, check object properties, investigate unexpected behavior, and test changes in the running project. You and your agent can move between source code and the live scene, using what actually happens in the browser to guide the next edit.
Installation
- Visit the Needle Inspector page on the Chrome Web Store
- Ensure you are using Google Chrome or a Chromium-based browser
- Click "Add to Chrome" and you're ready to go!
FAQ
Does the inspector slow my site down?
The Inspector hooks into scenes on sites where you enable it. Inspection, frame capture, and other tools add work, so the impact depends on the scene and the tools you use. Disable it from the toolbar when you finish; the page reloads without the Inspector.
Does my scene data leave the browser?
Inspecting runs entirely in your browser — your scene is not uploaded anywhere. Only when you actively use the built-in AI chat is the relevant scene context sent to Needle Cloud to answer your request. When you connect your own AI tools via MCP instead, your scene context goes directly to them — not through Needle Cloud.
What usage data does the inspector collect?
The Inspector records feature usage, such as which panels and tools you open, resource counts, and object types. These events use types such as MeshStandardMaterial, rather than object names. Analytics also include the inspected page's hostname and path, plus the page title and referrer in pageview events, browser information, language, and screen size. Once you sign in, analytics include account details. If you use the built-in AI chat, we also record prompt text to help improve the assistant.
We deliberately don't collect the names of your objects, materials, textures or assets, what you type into search fields or text inputs, or the query string of pages you inspect. Crash reports are limited to errors thrown by the inspector's own code.
Analytics are sent directly to Needle. If you have questions about data collection or requirements for your workplace, contact us.
Does it work for my local development?
Yes. You can inspect scenes on localhost and LAN development servers, including projects served with Vite or webpack. Live editing on development servers requires Pro. Changes affect the running scene; a reload or hot update can replace edited objects. Use File → Save Edits to save them, or ask your AI agent to read them via MCP and apply them to your source code.
Which three.js versions and frameworks are supported?
The Inspector supports modern three.js versions with WebGL and WebGPU renderers, including scenes built with React Three Fiber, Threlte, and A-Frame. Detection and available tools can vary with the three.js version and how the site creates its scene.
Do I need Needle Engine?
No. The inspector works on any three.js scene. Needle Engine projects get extra features on top (component editing, networking inspection, XR debugging).
What does Pro cost?
Needle Inspector Pro is a one-time purchase — no subscription. The current price is always shown in the extension (Get Pro in the toolbar). It's included with Needle Engine Pro licenses.
Where can I buy Needle Inspector Pro?
Buy Needle Inspector Pro →. Sign in or create a Needle account to complete the purchase. If your account already includes Pro, you can use it without buying another license.
Can I inspect websites I didn't build?
Yes. Scene inspection is free on supported public websites, and you can edit properties on ordinary public sites. Pro adds editing on development hosts, node-graph drill-down, full resource lists, Inspector MCP tools, AI editing, and export. See Free vs Pro.
How do I install the Needle Inspector?
Install it free from the Chrome Web Store — click Add to Chrome in Chrome or any Chromium-based browser (Edge, Brave, Arc, Opera). No account needed to start inspecting.
Open a page with a three.js scene, then click the Needle toolbar icon to enable the Inspector for that site. The page reloads — see Quick Start.
What Developers Are Saying
Things I love:
- Fly camera for exploration.
- Changing assets/textures in a click.
- Seeing the structure of the scene and show/hide elements.
- Quick edits of elements for debugging and exploring ideas/concept at a glance by directly changing three.js props from the UI.


Get the Inspector
Install free from the Chrome Web Store, then enable the Inspector on a page with a three.js scene.
Get Pro in the toolbar unlocks editing on development servers, node-graph drill-down, full resource lists, Inspector MCP tools, AI editing, and export. Needle Inspector Pro is a one-time purchase and is included with Needle Engine Pro.
Next Steps
- Learn about Needle Engine
- Explore three.js integration
- Get started with Needle in Unity
- Get started with Needle in Blender
- AI-Powered Development - Connect AI assistants to the inspector
Using Needle Engine?
The inspector has special features when used with Needle Engine projects, including component editing, networking inspection, and XR debugging tools.