Debugging Parameters & Options
Debug and inspect your Needle Engine projects using built-in tools, browser DevTools, and the Needle Inspector.
Also See
- Local Development Help - Test on mobile devices, VR headsets, and set up certificates
- Help & Community - Get support and ask questions
Fastest way to debug: read the log files
The quickest way to debug a Needle Engine project — on desktop, mobile, Meta Quest, Apple Vision Pro, or any WebXR headset — is to read the Vite log files on disk. While your local dev server is running, the Needle Engine Vite plugin writes both client-side logs (the browser console) and server-side logs (the dev server / build) to:
node_modules/.needle/logsThis means you usually don't need to attach DevTools at all, which matters most on devices where remote debugging is awkward or impossible (Quest, iOS/iPadOS, visionOS, WebXR). Just reproduce the issue on the device, then open the log file on your computer.
Three ways to use these logs:
- Open the files directly in your editor — no USB cable, no on-screen console, no squinting at a headset.
- Point your AI coding assistant at them (Claude Code, Cursor, Copilot, etc.). It can read the logs to debug with real context instead of guessing — and drive a hands-on loop: it tells you what to tap on the device, you reply "done", and it reads the freshly written logs. See AI & Needle Engine.
- Use the Needle MCP Server so an AI assistant can read your editor and project logs over MCP automatically.
See Log files below for details.
Needle Inspector — DevTools for three.js
The Needle Inspector is a powerful Chrome extension for inspecting and debugging three.js, react-three-fiber, and Needle Engine projects directly in your browser.
Key features:
- Real-time scene hierarchy inspection
- Edit properties and see changes instantly
- Performance monitoring (FPS, stats)
- AI-powered assistance with MCP integration
- Works on any three.js website
Learn more about the Needle Inspector →
Useful resources for working with glTF
To inspect glTF or glb files online:
- gltf.report - three.js based
- modelviewer.dev/editor - three.js based
- Khronos glTF Sample Viewer
- Babylon Sandbox
- glTF Validator
To inspect them locally:
- use the glTF Shell Extension for Windows to convert between glTF and glb
- use the glTF Tools VS Code Extension to see validation errors and in-engine previews locally
Built-in URL parameters
Debug Flags can be appended as URL query parameters.
Use ?help to get a list of ALL parameters available.
Here are some of the most commonly used:
helpprint all available url parameter in the consoleconsoleopens an on-screen dev console, useful for mobile debuggingprintGltflogs loaded gltf files to the consolestatsshows FPS module and logs threejs renderer stats every few secondsshowcollidersvisualizes physics collidersgizmosenables gizmo rendering (e.g. when using BoxCollider or AxesHelper components)- and a lot more: please use
helpto see them all
Debug Methods
Needle Engine also has some very powerful and useful debugging methods that are part of the static Gizmos class. See the scripting documentation for more information.
Log files
When running the local dev server, the Needle Engine Vite plugin writes logs to files inside your web project's node_modules/.needle/logs directory. Both client-side logs (from the browser) and server-side logs (from the dev server / build process) are captured there.
This is useful when:
- you want to inspect what happened without keeping the browser console open
- an error scrolled out of view or happened on a device you can't easily attach DevTools to
- you want to share a log with support or feed it to an AI assistant (see AI & Needle Engine)
node_modules/.needle/logsTips
The related node_modules/.needle/needle.alias.log file logs how imports are resolved — useful for diagnosing the wrong version of a package being picked up. See the Needle Vite Plugin reference.
Send logs for support
When you report a bug, support can read your logs directly instead of asking you to copy files into Discord or email. The needle-cloud CLI can bundle and upload your recent logs and give you back a short reference ID to include in your report:
npx needle-cloud send-logsBy default this uploads the current and previous CLI logs plus the editor log of your most recently used project (Unity or Blender). Sensitive data — access tokens, home directory paths, email addresses and environment variable values — is redacted before anything leaves your machine. The command requires you to be signed in (npx needle-cloud login); nothing is ever uploaded automatically.
On success it prints a reference like nlc-abc123def — share that ID in your bug report.
Options
| Option | Description |
|---|---|
--note <text> | Attach a one-line note describing the issue. |
--crash | Upload a minimal crash payload only (smaller). |
--dry-run | Print exactly what would be uploaded without sending anything. |
Local Testing of release builds
- First, install http-server:
npm install -g http-server - make a build (development or production)
- open the dist folder with a commandline tool
- run
http-server -g|-genables gzip support - optional: if you want to test WebXR, generate a self-signed SSL certificate, then run
http-server -g -Sto enable https (required for WebXR).
VSCode
You can attach VSCode to the running local server to set breakpoints and debug your code. You can read more about debugging with VSCode here.
Create a launch.json file at .vscode/launch.json in your web project with the following content:
{
    "version": "0.2.0",
    "configurations": [
        {
            "type": "chrome",
            "request": "launch",
            "name": "Attach Chrome",
            "url": "https://localhost:3000",
            "webRoot": "${workspaceFolder}"
        }
    ]
}
If you have changed the port on which your server starts make sure to update the url field accordingly.
You can then start your local server from within VSCode:
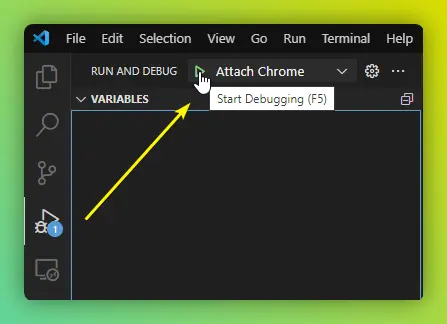
Mobile Debugging
Easiest option: read the log file
On phones, tablets, and headsets (Android, iOS/iPadOS, Quest, visionOS, WebXR) you don't have to attach DevTools at all. The Needle Engine Vite plugin writes both client-side and server-side logs to node_modules/.needle/logs on your dev machine — so you can just open that file to see what happened on the device.
This is a big time-saver even without AI: no USB cable, no remote inspector, no squinting at an on-screen console — just test on the device and read the log on your computer. And if you are using an AI assistant, point it at the file so it can drive a hands-on loop: it tells you what to tap, you reply "done", and it reads the fresh logs. See Log files and AI & Needle Engine.
The platform-specific options below are still useful when you need live inspection (breakpoints, network, DOM).
 Android Debugging
For Android debugging, you can attach Chrome Dev Tools to your device and see logs right from your PC. You have to switch your device into development mode and connect it via USB.
See the official chrome documentation here
- Make sure Developer Mode is enabled on your phone
- Connect your phone to your computer via USB
- Open this url in your browser
chrome://inspect/#devices - On your mobile device allow the USB connection to your computer
- On your computer in chrome you should see a list of open tabs after a while (on
chrome://inspect/#devices) - Click
Inspecton the tab you want to debug
 iOS Debugging
For easy iOS debugging add the ?console URL parameter to get a useful on-screen JavaScript console.
If you have a Mac, you can also attach to Safari (similar to the Android workflow above).
WebXR usage and debugging on iOS requires using a third-party browser: Mozilla WebXR Viewer.
 Quest Debugging
Easiest: read the log files on your dev machine. The Needle Engine Vite plugin writes the Quest's browser console (and the dev server output) to node_modules/.needle/logs, so you can debug a VR session without attaching anything to the headset — open the file yourself or let your AI assistant read it. Add the ?stats URL parameter to see FPS, draw calls, and memory in-headset, and ?console for an on-screen console.
For live inspection (breakpoints, network, DOM): Quest is just an Android device, so attach Chrome DevTools via USB — see the Android Debugging section for steps.
Related Documentation
- Local Development Help - Testing on mobile devices, VR headsets, and certificate setup
- Needle Inspector - Chrome DevTools extension for three.js
- Needle MCP Server - Use AI assistants to debug and inspect scenes
- FAQ - Frequently asked questions and troubleshooting
- Help & Community - Get support, ask questions, and connect with the community